Advanced content marketing and analytics
Posted in Tutorials on Sep 01, 2016
In our previous posts we described how you can create a multi-language blog (part 1, part 2) and how to configure October CMS for sending email campaigns. In this article, we'll summarize those topics and show you how to use October CMS as an affordable but powerful content marketing tool.
Setting up Google Analytics
Content marketing can be a time consuming task and the ability to evaluate the content marketing success while tracking the return on investment (ROI) is critical for any business. Google Analytics is one of the best analytics services available today.
October CMS has a free Google Analytics plugin that can be downloaded from the Marketplace:
-

Google Analytics plugin
Provides the Google Analytics tracking and reporting.
In order to add the plugin, you should first create a project on octobercms.com and bind the plugin to that project. The plugin will be automatically downloaded to your October installation the next time you perform a software update.
Using the Google Analytics plugin requires API permissions in your Google account. The plugin documentation contains detailed instructions on how to do this. Follow them to configure your Google account along with October.
We highly recommended using separate Google Analytics properties for your development, staging and production environments. This will avoid polluting your production analytics with test data.
Adding the tracking code to pages
As the Google Analytics tracking code should be included in all website pages, it is best to add it to the layout in your theme. Layouts are commonly used by all pages, so adding the code to the layout means it will automatically be included on every page that uses that layout. If you have multiple layouts, add the tracking code to all of them.
Open your CMS layout in the CMS editor and drag Google Analytics Tracker to the layout code, right before the closing </head> tag:
    {% component 'googleTracker' %}
</head>
That's it! Now save the layout and open any website page to make sure that the tracking code is included. Refresh the page several times and make sure that you see your session in Google Analytics Real Time view.
Adding Google Analytics dashboard widgets
Google Analytics dashboard widgets are optional, but having them installed is handy as you can see your favourite metrics right in October back-end.
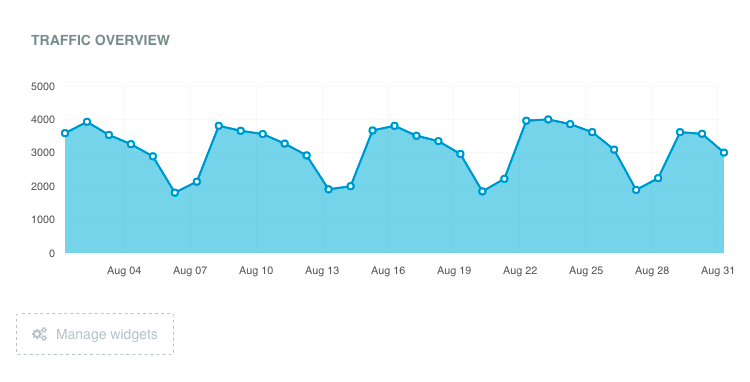
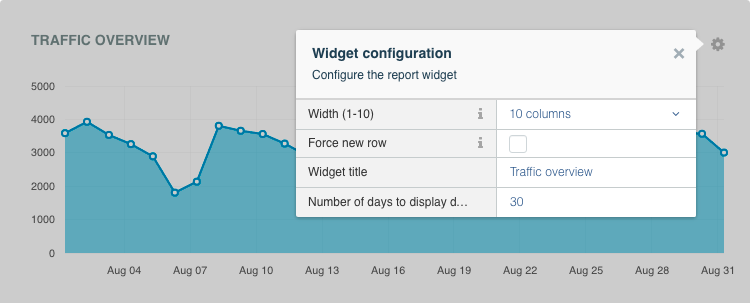
To install dashboard widgets, first open the Dashboard in the back-end of October and then click the Manage widgets button. Select Add Widget in the menu, then select a widget you want to add and click Add button. After adding a widget you can configure it by clicking the little settings icon in the top right corner of the widget.
If you like using dashboard widgets, but the standard widgets provided by this plugin are not enough, then there's another free plugin that you might enjoy:
-

Google Analytics Extension
Includes custom dashboard reports for virtually any Google Analytics metric.
Using Google Analytics to track email subscriptions
Google Analytics is a very powerful and flexible tool with countless possibilities. In this section we will show you how to use the Google Analytics Events feature to track subscribers who join our newsletter mailing list. The mailing list subscription form was described in the previous post called Affordable email marketing with October CMS.
Events should be triggered by your own JavaScript code. When you trigger an event, you should provide several properties (see the Anatomy of Events help article for more details). Each event should have at least two properties:
category- specifies the broad scope of interactions, for example "marketing". Try to categorize all your events from the beginning, otherwise you could end up with messy reports in Google Analytics.action- specifies the user action, for example "email-subscription".
Events also support two optional parameters:
label- used to pass information about specific elements the user interacted with, for example "Blog post form" or "Footer subscription form".value- specifies a numeric value associated with the event for advanced Google Analytics reporting.
You can test triggering an event by adding the following snippet to your CMS layout markup, and then refreshing the front-end page:
<script>
    ga('send', 'event', 'marketing', 'email-subscription', 'Blog post form');
</script>
If you did everything right, you should see the event in Google Analytics Real Time Events report. Click Events (Last 30 min) to see real events rather than users:
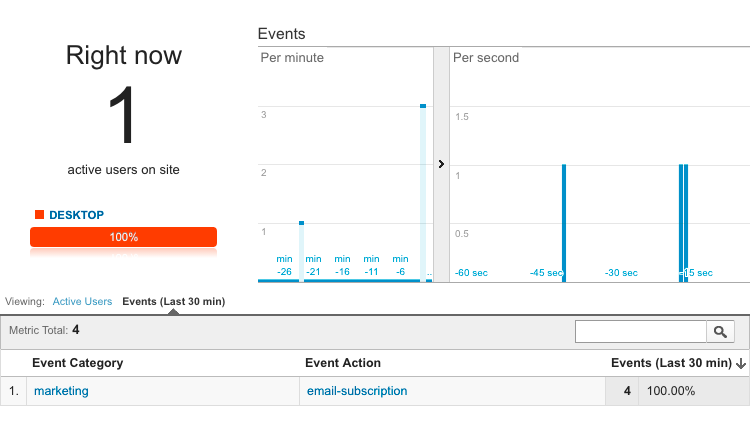
Don't forget to remove the code after you finish testing!
Tracking email subscriptions
In the previous blog post we demonstrated how to create a subscription form with the Campaign Manager plugin. Now let's track each subscription with a Google Analytics event. This will allow us to see the subscription activity in the Google Analytics reports. More importantly it measures what pages or blog posts generate the most subscriptions. Knowing that will allow you to manage your content more effectively, providing your visitors with the most interesting information.
It's important that this feature is not built directly into the Campaign Manager or Blog plugin directly. October by nature is a flexible tool and will allow us to extend these plugins to get the desired outcome. All it takes is a little bit of creativity!
We'll start by creating a custom partial for the subscription form. This partial will be displayed when a visitor enters their email address and hits the Subscribe button. This approach doesn't use the component partial overriding technique, which could be another option.
In the CMS editor create a new partial and save it with the name campaign-signup-result. Paste in the following code for the partial contents, this code was copied straight from the default Campaign Manager component partial:
{% if error %}
    <div class="alert alert-danger">Sorry there was an error: {{ error }}</div>
{% elseif isThrottled %}
    <div class="alert alert-warning">
        Please wait a few minutes before making another subscription request.
    </div>
{% else %}
    <div class="alert alert-success">
        {% if requireConfirmation %}
            We have sent you an email to confirm your subscription, please check it.
        {% else %}
            Thanks for subscribing, we appreciate your interest in October CMS!
        {% endif %}
    </div>
{% endif %}
So far it doesn't send any events to Google Analytics but it does show all the possible outcomes for the subscriber. We should include some tracking somewhere around the area where the success message is displayed. Include this JavaScript code in the partial, just above the <div class="alert alert-success"> opening tag (line 6):
<script>
    ga('send', 'event', 'marketing', 'email-subscription', 'Blog post form');
</script>
You may use any values for the event category, action and label. Now you need to update the subscription form itself to use the new partial we created. The subscription form described in the previous article had the data-request attribute like so:
<form
   data-request="campaignSignup::onSignup"
   data-request-update="'campaignSignup::result': '#signupFormContainer'">
The original value uses the standard partial provided by Campaign Manager called campaignSignup::result. Replace it with your new partial name:
<form
   data-request="campaignSignup::onSignup"
   data-request-update="'campaign-signup-result': '#signupFormContainer'">
You've successfully modified the subscription form results to use your own custom partial. Now submit the form to create a test subscription and make sure that the event was tracked by Google Analytics as expected.
By the way, you can track subscription errors in the same way. By adding another event just after the {% if error %} block (line 1), this will track how often your users receive subscription errors.
Viewing events in Google Analytics
The simplest way to view events in Google Analytics is to use the Behavior → Events → Overview report section. This report allows you to narrow down the event list from the event category to its own action or label.
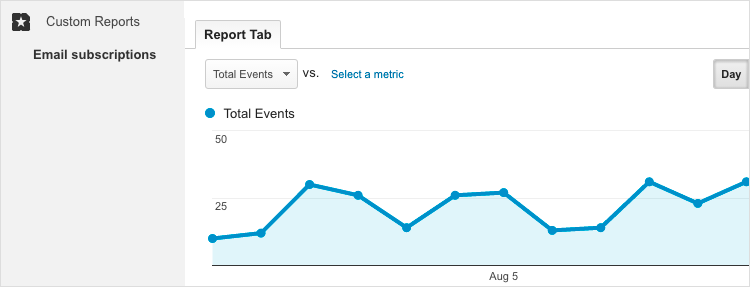
Another option is creating a custom report that would only show events of a specific category and label. Using custom reports is a handy feature since they come pre-configured, so you don't need to waste your time filtering out events you don't want to see every time.
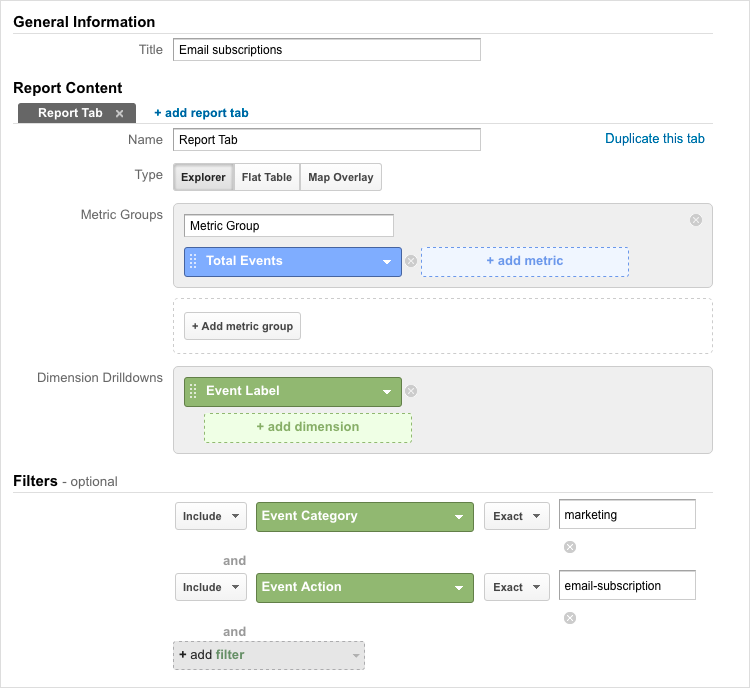
To create a custom report go to the Customization tab in Google Analytics and click the New Custom Report button. Provide the report title, for example Email subscriptions. In the Metric Groups click the Add metric button and type in "Total" while selecting the Total Events group.
In the Dimension Drilldowns click add dimension and find the item called Event Label in the list.
Now you should configure the event filter to display only events of a specific category and action. Click Add filter and find the Event Category item in the list. Leave the Exact value in the drop-down and enter the event category name in the text field, calling it marketing. Add another filter for the Event Action and use the value email-subscription for the event action name.
After saving the report you should see a new entry for it in the sidebar of the Customization tab.
Switching to the Customization tab every time you want to see your report might get annoying. Fortunately Google Analytics supports Shortcuts on the Reporting tab. These shortcuts let you create links to your existing custom reports and preview them on the Reporting tab, all without leaving your primary reporting workspace.
Google Analytics also supports dashboards on the Reporting tab. You can add custom reports to the dashboard in the same way that you add them to the Customization tab.
Viewing subscriptions per page
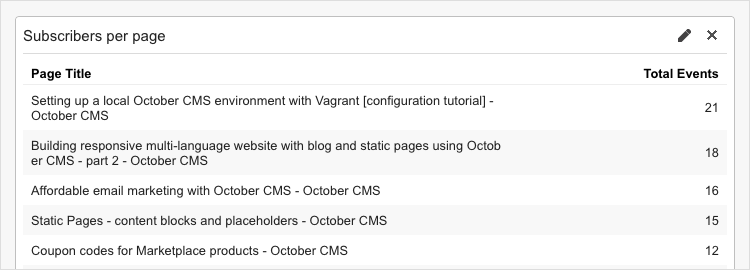
When you track an event with Google Analytics it also stores information about the page where the event was triggered, so you can find out the exact page where visitors subscribe the most. This approach is applicable not only to static pages, but also to blog posts and other dynamically created pages.
For custom tracking we should create a new report. We can make a custom report as explained above, or create a new dashboard report. On the Reporting tab create a new dashboard, if you don't have one yet. Click the Add widget button at the top of the dashboard. Type in the widget title, for example Subscribers per page and choose Table in the Standard widget group.
In the Display the following columns section select Page Title in the Dimension drop-down and Total Events in the Metric drop-down.
We will use the Filter this data section to display only events with the category called marketing along with the action called email-subscription. Click the Add a filter link and add select Only show in the first drop-down. In the Dimension drop-down select Event Category and Begins with in the third drop-down. Then enter marketing in the value input. Repeat the same step to add a filter that would display only events with Event Action beginning with email-subscription.
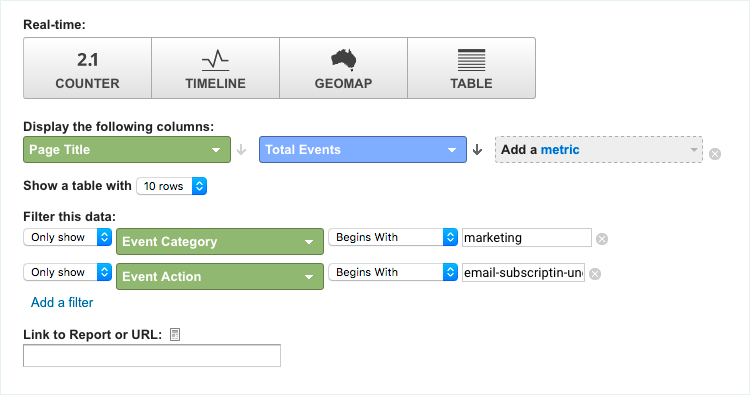
Click Save to save the report and preview the data on the dashboard
Conclusion
The techniques described in this article are just the tip of the iceberg of what you can achieve. Even a basic setup of Google Analytics tracking could provide you with valuable information for your marketing needs. There are many useful articles that cover this subject in further detail: