
This plugin provides two dashboard widgets showing statistics collected through the free Uptime Robot service:
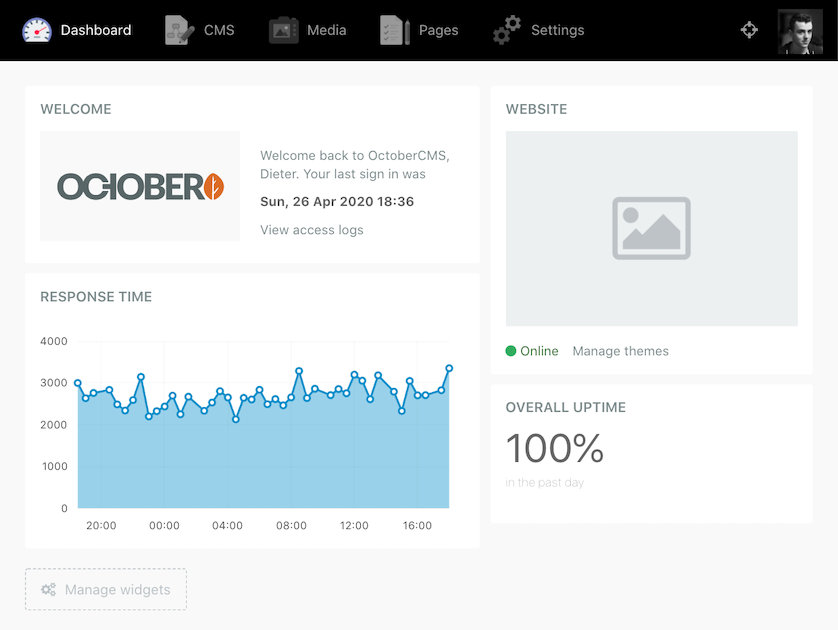
- Overall uptime: Shows a percentage indicating the overall uptime of your website.
- Response time: Shows a line graph with response times, collected every 30 minutes
Installation via Command Line
php artisan plugin:install DieterHolvoet.UptimeRobot
This plugin provides two dashboard widgets showing statistics collected through the free Uptime Robot service:
- Overall uptime: Shows a percentage indicating the overall uptime of your website.
- Response time: Shows a line graph with response times, collected every 30 minutes
To prevent reaching API rate limits, the displayed data is refreshed every 5 minutes.
Configuration
To configure the plugin, go to the settings page in the backend. This plugin's settings can be found under the System section.
Configuration can also be provided through code by creating a configuration
file config/dieterholvoet/uptimerobot/config.php, or config/dieterholvoet/uptimerobot/dev/config.php for environment-specific configuration. Inside the overridden configuration file you can return only values you want to override.
<?php

return [
    'api_key' => 'xxxxxxxxxx-xxxxxxxxxxxxxxxxxxxxxxxx',
    'monitor_id' => 000000000,
];
-

Kai
Found the plugin useful on 11 Feb, 2021
Excellent! Thank you so much for the gift.
-

| 1.0.2 |
Fix permissions not being checked May 10, 2020 |
|---|---|
| 1.0.1 |
First version of UptimeRobot Apr 26, 2020 |